「欢快的搭建好 Prometheus」之后,记录我们 nodejs 应用的指标就是一件更欢快的事了。
脑洞主要是在应用中引入一个外部的 node 模块,这个模块提供了对 Prometheus 指标类型(metric types)的支持。本文中用到的是 Counter 和 Gauge 。这个模块通过一个轻量的 express 服务暴露统计数据,以便 Prometheus 来抓取。
记录应用数据
每个应用都可能有许多有意思的指标。比如我要对 Realtime Bitcoin Globe 添加 websocket 服务,它将关于比特币交易消息中继到连接的 web 客户端。通过 Prometheus 我们可以很容易获取下面的指标:
- 服务发送了多少个 websocket 消息?
- 服务有多少活跃的 websocket 连接?
- 新建链接?
- 内存占用?
这些统计必须通过指标来实现。同时记录的指标包括:中继延迟(从接收发送到Websocket客户端的事务需要多长时间?)、交易细节(记录经过系统的交易)或者数据库查询(执行时长、查询类型、缓存命中)等。记录的内容无尽可能。
通过 Prometheus 类似的稳固的监控系统,可以更直观地了解应用当前的状态。这些(收集来的)数据在出状况、衡量某项优化效果(或想找出可优化点)时帮你大忙。
这里采用的是一个很轻量的 NPM 包 prometheus-client ,刚好能满足我们的需求。
monitor.js
var Prometheus = require('prometheus-client');
client = new Prometheus();

module.exports = {
  connections: client.newCounter({
    namespace: 'blocks_wizbit',
    name: 'new_connections',
    help: 'The number of new connections.'
  }),

  messages: client.newCounter({
    namespace: 'blocks_wizbit',
    name: 'send_ws_messages',
    help: 'The number of send websocket messages.'
  }),

  connectedUsers: client.newGauge({
    namespace: 'blocks_wizbit',
    name: 'active_connections',
    help: 'The number of active connections.'
  }),

  memoryUsage: client.newGauge({
    namespace: 'blocks_wizbit',
    name: 'memory',
    help: 'The current used memory.'
  })
}

client.listen(9095);
最后一行通过模块自带的 express 服务监听在 9095 端口。
现在可以在任何想要监控的地方引入 monitor.js,比如在处理所有 websocket 服务逻辑的地方:
const monitor = require('path/to/monitor.js');

server.on('connection', e => {
  monitor.connections.increment();

  // 其它逻辑
});
再比如监控活跃用户:
setInterval(() => {
  monitor.connectedUsers.set({
    period: '10sec'
  }, server.connections());
}, 10000);
创建图表
前面用了 promdash (看如何安装博客),留意其中查询的部分:
服务发送了多少个 websocket 消息(每秒)?
rate(blocks_wizbit_send_ws_messages[1m])
有多少个活跃 websocket 连接?
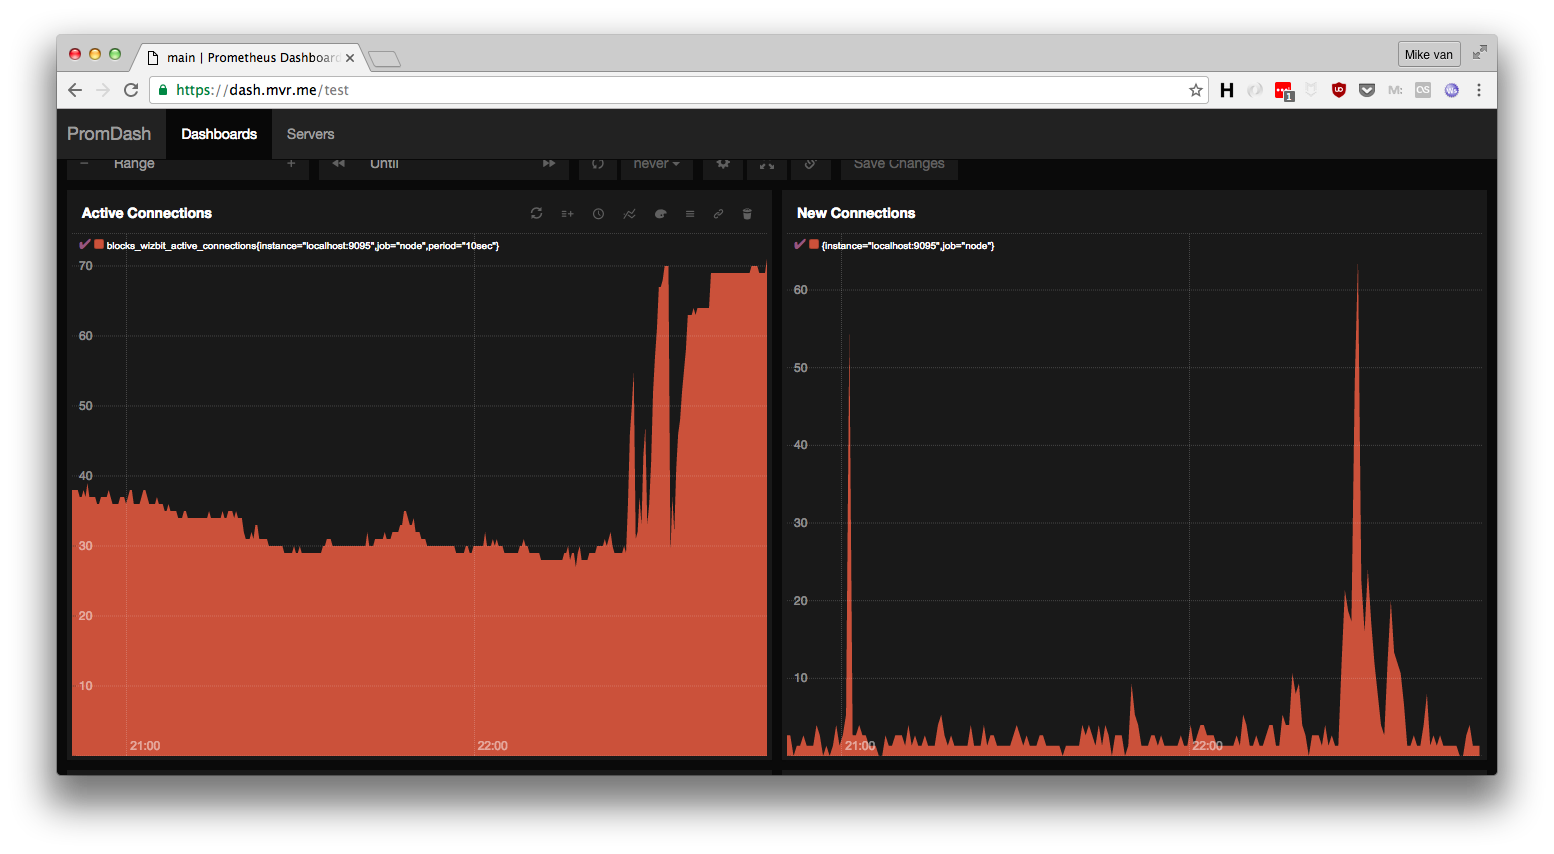
blocks_wizbit_active_connections
新建了多少连接(每分钟)?
rate(blocks_wizbit_new_connections[1m]) * 60
内存占用(单位 mb)
blocks_wizbit_memory / 1024 / 1024
最终图表长这样:
本文根据 askmike 的《Monitoring nodejs apps with Prometheus》所译,整个译文带有我们自己的理解与思想,如果译得不好或有不对之处还请同行朋友指点。如需转载此译文,需注明英文出处:https://askmike.org/articles/monitoring-node-apps-with-prometheus/ 。